
CHART: Utah House Bubble 2.0?

Published On: November 29, 2016 Posted by: Jeremy Peterson
Is Utah’s housing market overheating? Based on historical charts, it seems that it’s a good question to be asking right now. In the third quarter of 2016 (ending September) house prices in the Ogden-Clearfield Metro Statistical Area increased 1.86% from the previous quarter. They are up 7.66% over the past year and a whopping 26.4% from 5 years ago. Certainly, it has been a great time to own real estate. But how long can these month-over-month increases in property values continue?
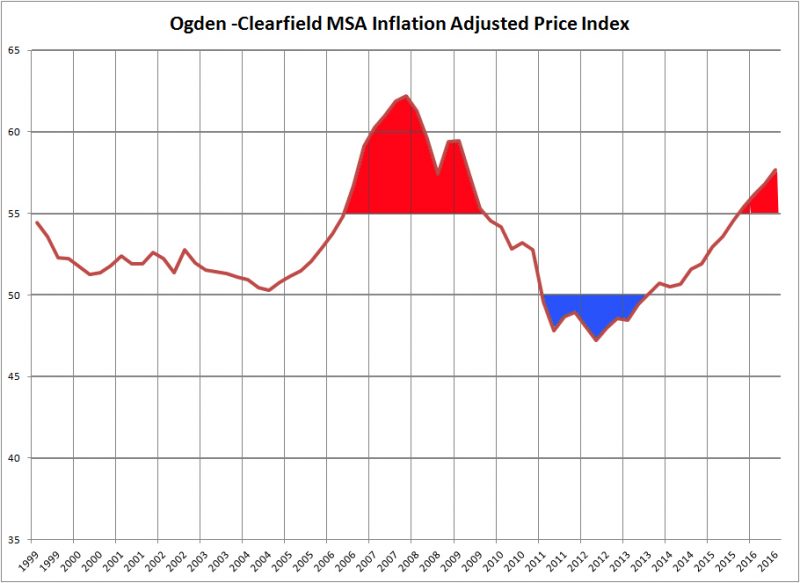
The above chart shows an inflation adjusted house price index for the Ogden-Clearfield area. I pulled house price index information from the FHFA site and then delfated it with CPI data from the Bureau of Labor statistics. This chart tells the 17 year history of the Weber/North Davis housing market.
In 1999, the area peaked after a long streak of increased house prices. Then a recession settled in and house prices began to decrease in inflation-adjusted terms. You can see the peak in 1999 was near 55 and the trough in 2004 was near 50. This is what, in my opinion, we would consider a normal range of high and low index values in the housing market cycle when adjusting for inflation. Then you can see our credit bubble take over in mid-2006. The index skyrockets and then plunges when the credit bubble popped. By late 2009 the index has fallen back into a normal range but continues its slide. In early 2011 the market sinks below its normal range and into severe correction territy. After languishing there for nearly two and a half years, the index finally breaks back into the normal range. But, by late 2015 the index broke above 55 again and now sits at 57.
So, what is different in 2016 from 2007? Exotic mortgages and loose mortgage underwriting are not part of the mix this time. Borrowers have jobs, down payments, and good credit. So, that provides a certain floor for house prices if they were to want to fall. Two other factors are also identical: strong jobs and in migration from other states. This has put pressure on housing supply which in turn is pushing up prices. However, the one component that is different this time is interest rates. Rates are significantly lower today than they were in 2007.
If rates increase, what happens to housing prices? Invariably, unless there is significant wage growth through inflation (possible) or productivity gains (which is doubtful) then house prices will have to decline in nominal terms. If inflation occurs faster than house prices can increase, then the real value of property will decline.
The next real estate market correction I see happening in several ways. First, I think interest rates are going to increase. This will begin to diminish the number of qualified buyers and price many of them out of purchasing a home they want. When buyers sideline themselves, inventory will begin to build and prices will begin to soften. At the same time, we may experience a wave of inflation from government spending. Such spending will increase wages but also continue to increase interest rates. The rate increases will effectively cap house prices as wages chase house payments ballooned by the higher interest rates.
So, the extremely hot market we are experiencing now may not end in a bang like last time, but rather fizzle out as it begins to chase its own tail. Look for subtle changes to come in the real estate market in 2017. It should be an interesting transition year.