
CHARTS: Weber County Home Sales Growth Seesaw
Published On: October 7, 2019 Posted by: Jeremy Peterson
Weber County home sales growth is a good measure of how the real estate market is performing locally. For Realtors, this measurement dictates whether being in the business is easy or hard. During periods of sales growth, agents enjoy a bountiful harvest of sales until word gets out about how easy it is and new agents join the ranks to take their share of the crop. When sales are shrinking (usually after a period of growth) agents joust with each other for business and work overtime in order to make the next sale. This process continues until agents get fed up with the work and leave the ranks. Then life gets easier for those who stay.
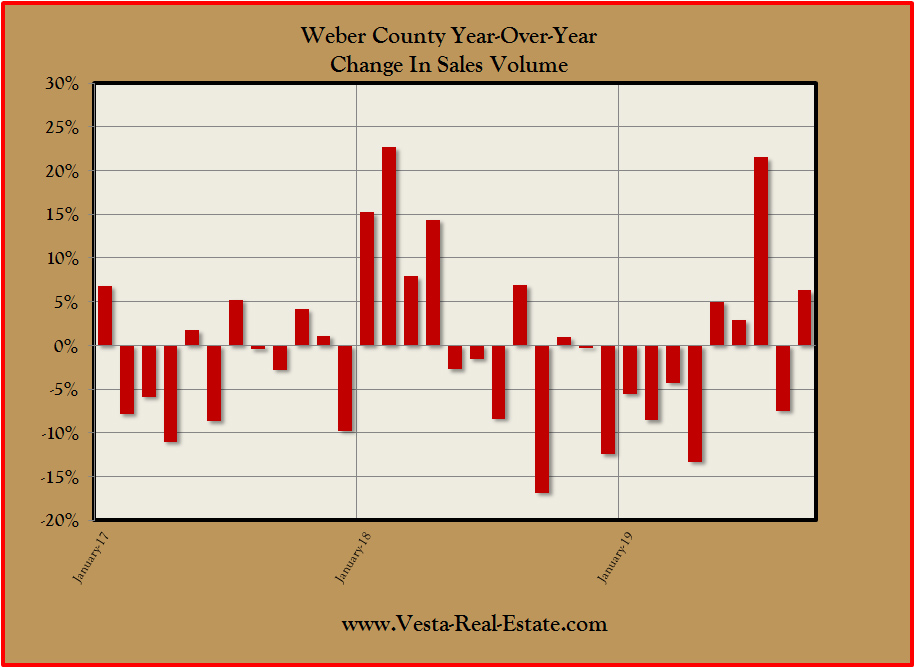
Having been in this business for over 15 years, I have seen the ups and down. But, what we are experiencing right now is unusual from the vantage point of my career experience. Let’s take a look at our first chart representing the past four years of sales growth.
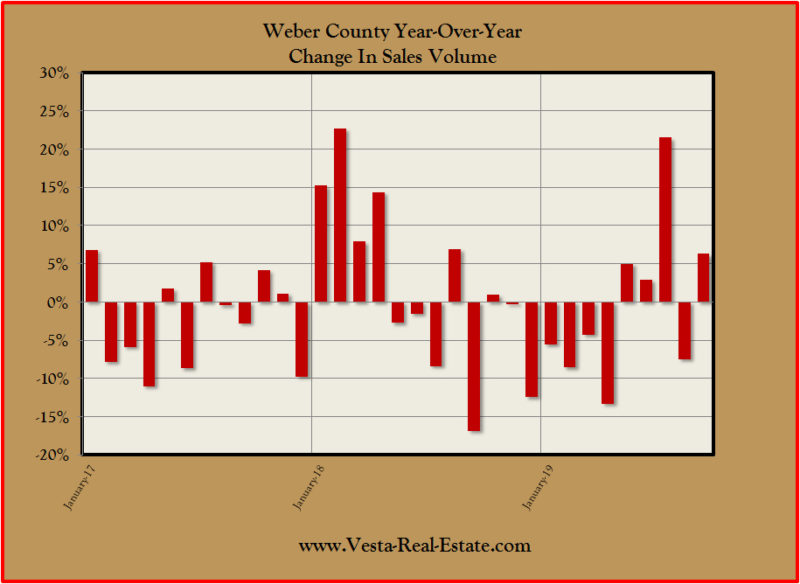
In this chart we see that sales were slumping in 2017. This was a year of significant price increase. With prices accelerating, potential buyers were tapped out as they scrambled to keep up to afford increasing prices. Inerestingly, in early 2018, there was a significant surge in growth only to see it falter for the last 2/3rds of the year. Then 2019 started out weak and only began to wake up during the past several months with July seeing a spike and then August a slump. The market seems to be wobbling back and forth between sales growth and contraction.
Lets take a look at a longer period of time to get some perspective.
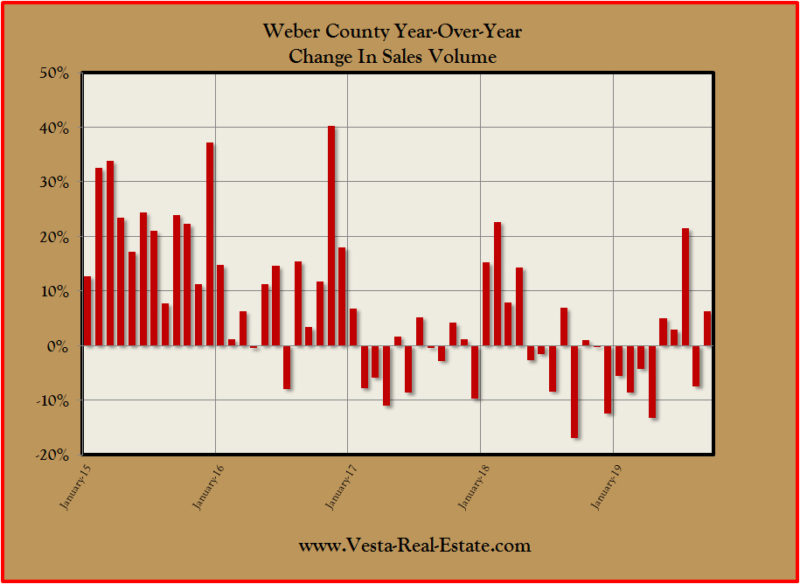
If we look back just a couple more years we can see how meek sales growth has become compared to a recovery year like 2015. With numbers back then printing at 30% year over year growth each month, todays figures can seem almost anemic.
But when we look back even further at Weber County home sales, we can be thankful.
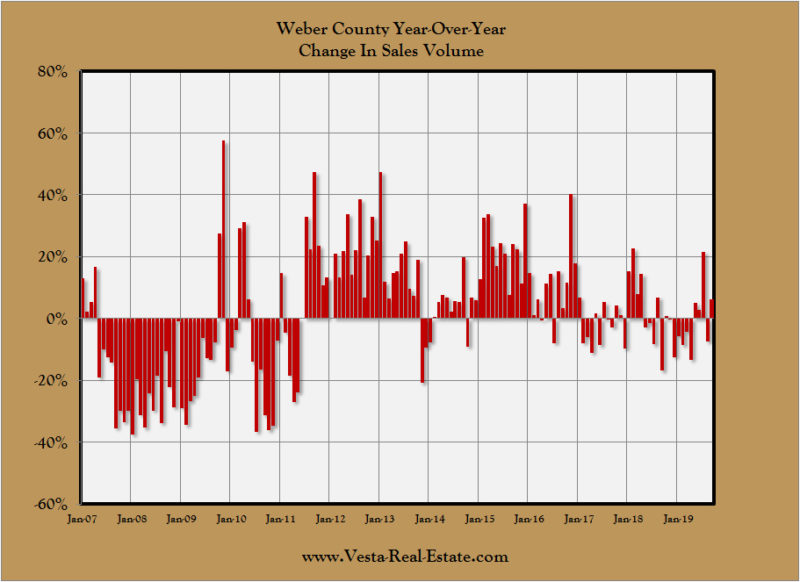
Here you can see the strong sales recovery years of 2012-2017 were preceded by the sales apocalypse of the Great Recession. Though our sales numbers might be mildly contracting in recent history, they pale in comparison to the stomach turning drop that hurled the real estate market into its worst condition in 80 years. So, let’s be happy with what we have going for us.
The big takeaway from these Weber County home sales charts is that the real estate market is in the process of turning over and shifting directions. Unlike the last abrupt shift in market direction, this turnover is creeping along at a snails pace and appears to promise to be much more subdued than last time. So, there is ample opportunity for anyone wanting to cash out at today’s superior home values.
If you are thinking of selling your home and want to know what it is worth, CONTACT ME, and let’s put a plan together to get you top dollar for your property. It is said that good things come to those who wait. But, if you wait too long at the top of the real estate market, this adage doesn’t apply.