
CHARTS: The Multi-Unit Story

Published On: April 18, 2023 Posted by: Jeremy Peterson
Utah’s housing market is broken up into different segments. One of the major divisions in housing stock is the difference between parcels designed for one occupant (i.e. townhomes, homes, condos) and those designed for multiple occupants (i.e. duplexes, triplexes, fourplexes, etc.). With Utah’s housing shortage now entering its 9th year, it seemed appropriate to take a look at the multi unit market and see how it has performed during this market cycle.
While demand for housing has put pressure on all available housing stock, the multi-unit universe operates by different financing rules than regular homes. Thus, the charts may shed some light on the impact that has on sales and value.
Here are the charts:
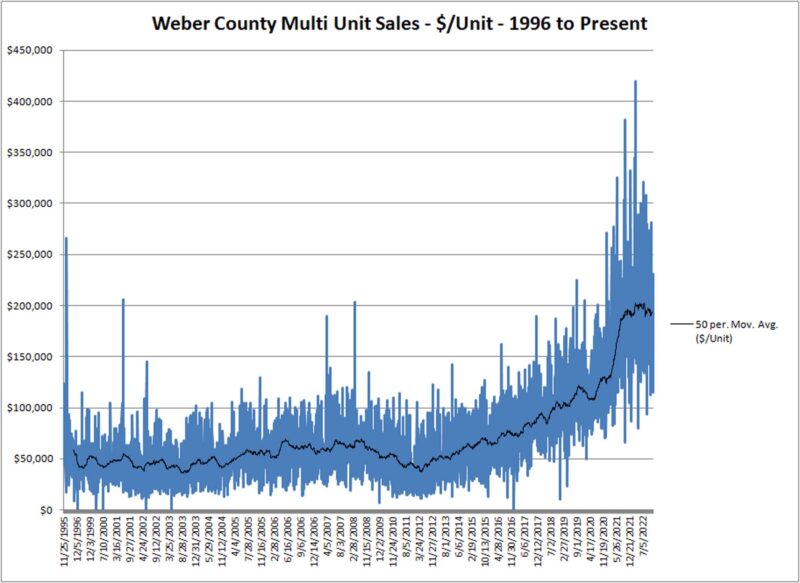
Our first chart here shows the $/Unit for sales of multi-unit housing since 1996. This answered the question of how much someone is willing to pay to have a unit to rent to a tenant. There are a couple things to note here. First, the broad range at any given time reflects the age and condition variables that exist in this market. A building may have good tenants and be in good condition. Or, it may have the opposite. The range has broadened in recent years. Secondly, the moving average for this range seems to taken off like a rocket since 2012. After fluctuating around $50,000 per unit for 15 years, the average now hovers around $200,000 per unit. That is a 400% increase! It is also worth noting that the moving average appears to be rounding over a top this past year.
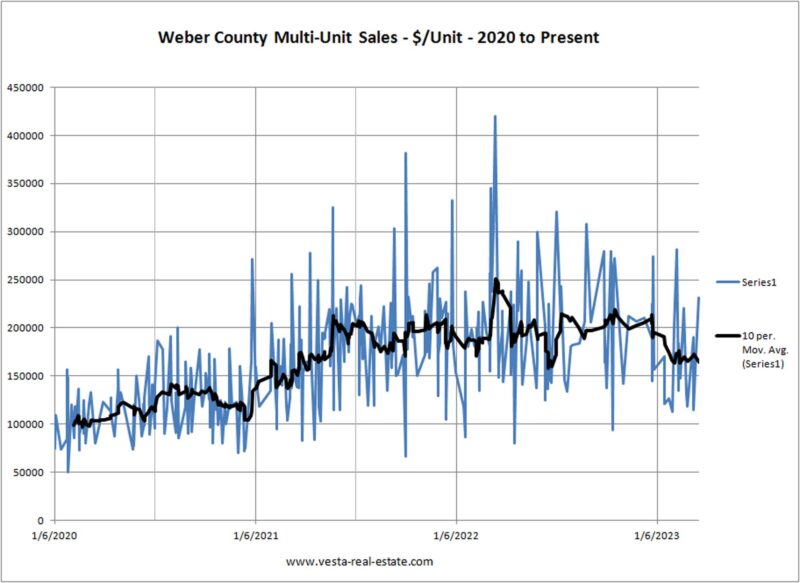
Our second chart is the same measure of $/Unit but zoomed in to the past three years. Here you can see the peak in early 2022 and then a sag that has really begun to settle in for the first part of 2023. The range also appears to be tightening in the past 6 months.
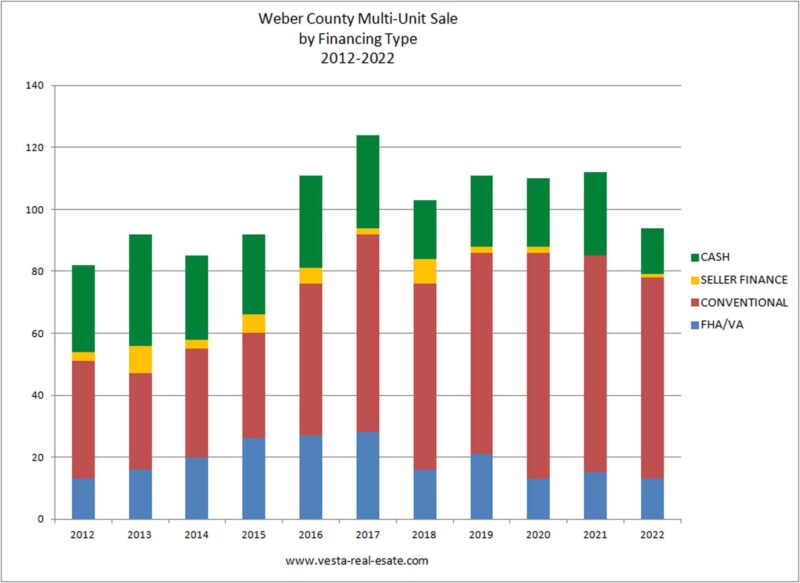
Finally, we see the financing mix for purchases over the past 10 years. There are several points of interest here. It appears our sales volume count peaked in 2017 and has been declining since. This could be attributed to the increasing price barrier. The big drop in 2022 is most likely attributed to the interest rate shock that disqualified potential buyers.
When looking at the mix, cash buyers have remained present but are at a low proportion of sales recently. Conventional loans dominate financing right now. Seller financing is nearly non-existent. This could also be attributable to the fact that sellers have existing payments at low rates and in order to capture their existing equity in a loan, the subsequent mortgage rate has to be VERY low to make the transaction pencil for a buyer. This has been a hurdle for many sellers looking at seller financing right now. Finally, our FHA/VA cohort of buyers (owner occupants) has slumped to a low level.
It is anticipated that 2023 will be an adjustment year as the market digests higher interest rates and tries to find equilbrium between price, payments, and rent income. That process is ongoing and takes time.
In the meantime, if you are thinking about purchasing income property and need an expert to guide you through the process, give us a call at 801-390-1480.