
CHART: Price Increases Pop…Again!
Published On: January 26, 2022 Posted by: Jeremy Peterson
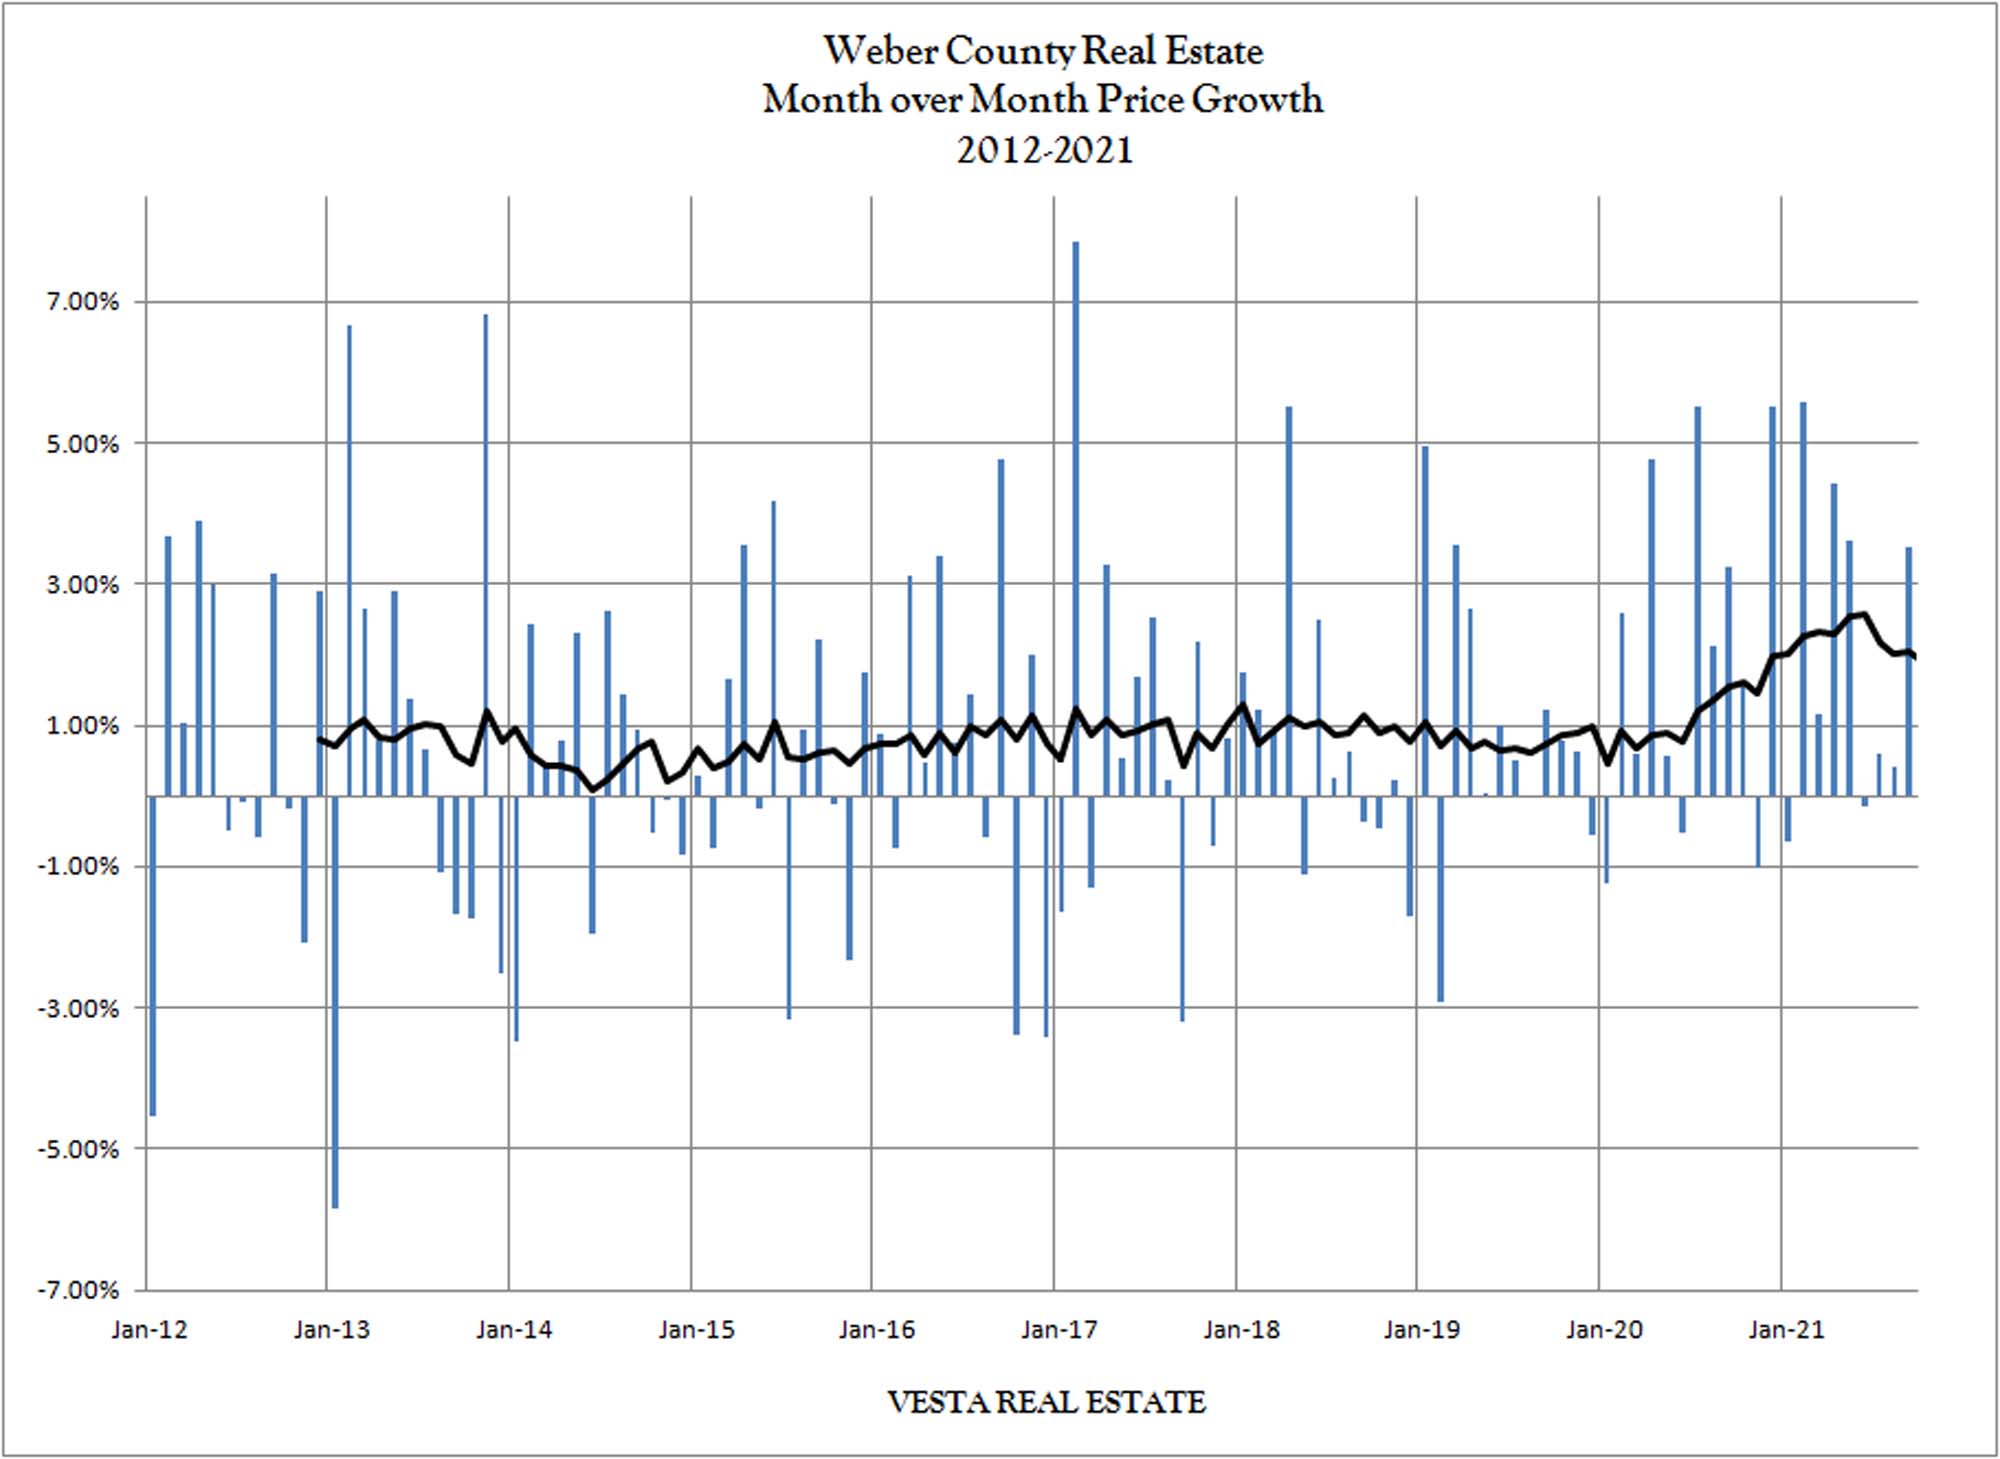
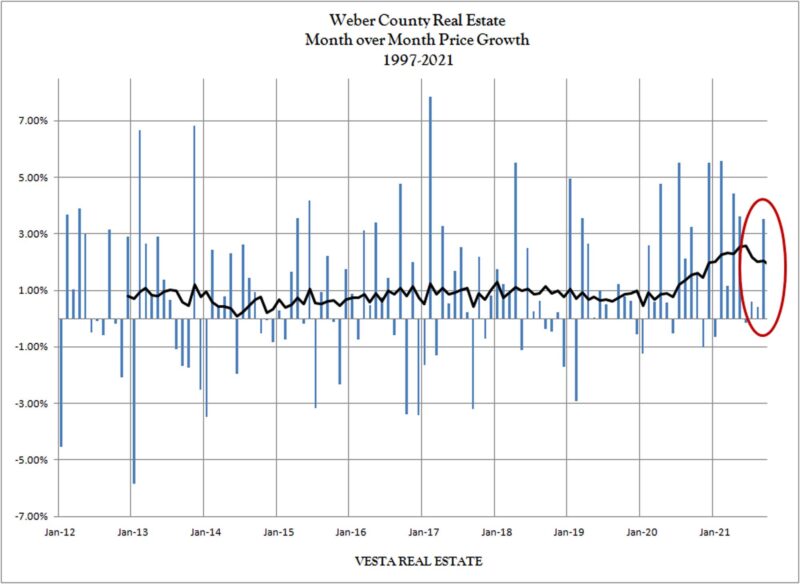
In our latest market update video we discussed the buyer panic to find housing right now. With this sudden increase in the buyer pool, home prices are again finding their way upward as bidding wars ensue. The chart below shows house price increases on a month-over-month basis (blue bars) and the 12-month moving moving average (black line). While recent months have leaned toward moderation at less than 1.00%, December’s increase is dramatic by comparison:
Rising interest rates, or the threat of them, have brought demand forward. To make matters more difficult, this has happened during the time in the season when inventory is historically at its lowest. Combine low supply and big demand and presto…you have price increases. Hopefully these conditions will moderate as we move into Spring with higher inventories. When higher interest rates do arrive (soon!) we should also see demand taper. We all know the cliche saying: What goes up must eventually reach an equilibrium point based on system dynamics. Perhaps this version is less popular. But it’s true. The year ahead should be (hopefully) less exciting than what we are seeing in January.
If you are in the market to buy or sell your home, give me a call and let’s put a plan together that helps you navigate this ever changing marketplace. Jeremy Peterson 801-390-1480