
CHARTS: Pent Up Demand?

Published On: January 24, 2024 Posted by: Jeremy Peterson
The recent slump in sales volume has discouraged many in the real estate industry. However, there are powerful demographic forces lying under the surface that have the potential to kick the market back into overdrive. To begin our discussion, let’s look at Weber County’s population growth vs. sales volume growth.
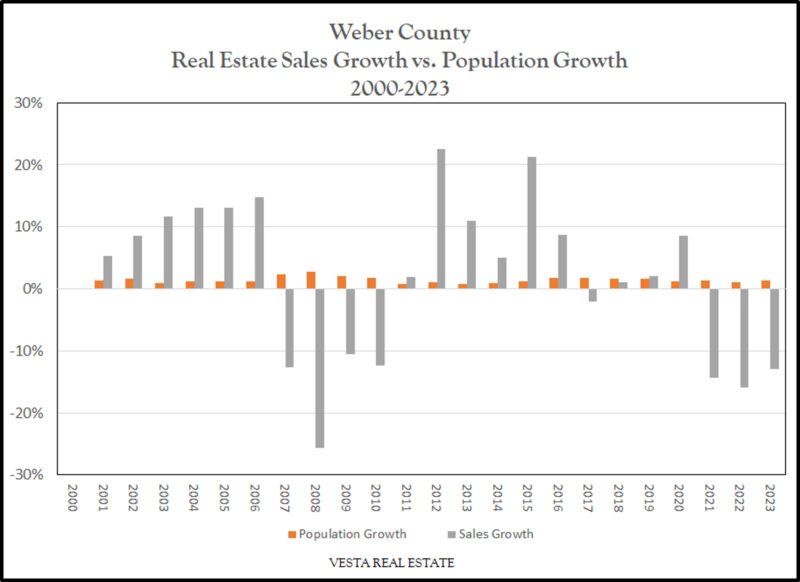
In a perfect homogenous world, we would expect sales volume to increase in lockstep with population growth. Of course, interest rates would never change, the ratio of homeowners to renters would be fixed, people would move-up at fixed intervals, and household size would fit uniformly into a pattern. This isn’t the case, and that explains a lot of the variation we see in sales volumes when compared to the steady increases in population.
In the run up to the Great Financial Crises, more homes were being built than there were households to live in them. This supply glut caught up to the market and the financial plumbing that makes it function. The result was massive foreclosures and a distressed period where housing supply waited for population to catch up. It took about four years for that to happen and, in 2012, sales volume began increasing again along with prices. Since that time, housing supply has not kept up with demand by households.
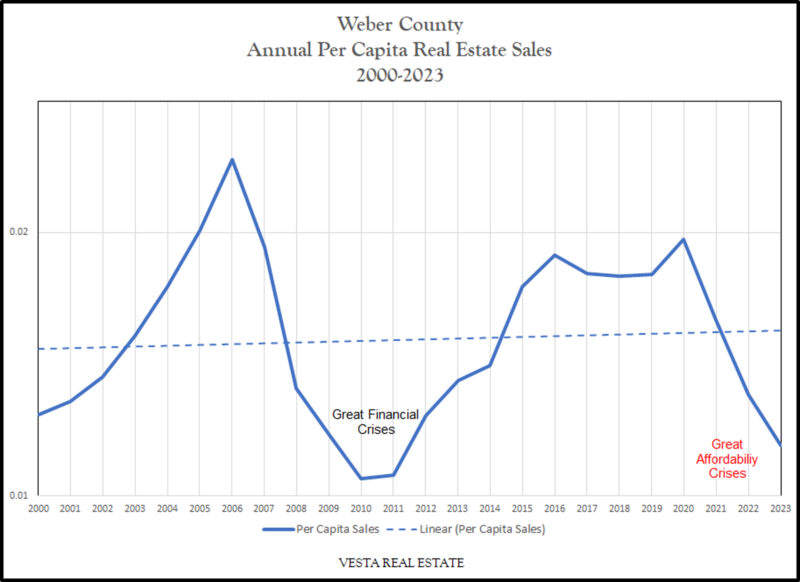
Our per capita chart shows the number of real estate sales transactions per person in Weber County for each given year. By this standard, we can see the manic boom prior to the Great Financial Crises still exceeded the frenzy that was unleashed by COVID. But, the elevated sales levels were sustained for a longer period during the most recent boom cycle. Since that time, sales per capita has collapsed back to where it was during the GFC.
Yet, there is some sunshine peeking through the clouds. When we take a look at long term averages, we can see that sales growth and population growth are closely aligned.
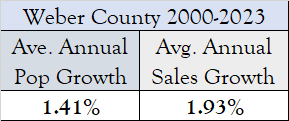
This average annual sales growth shows up in the trendline of our long term chart.
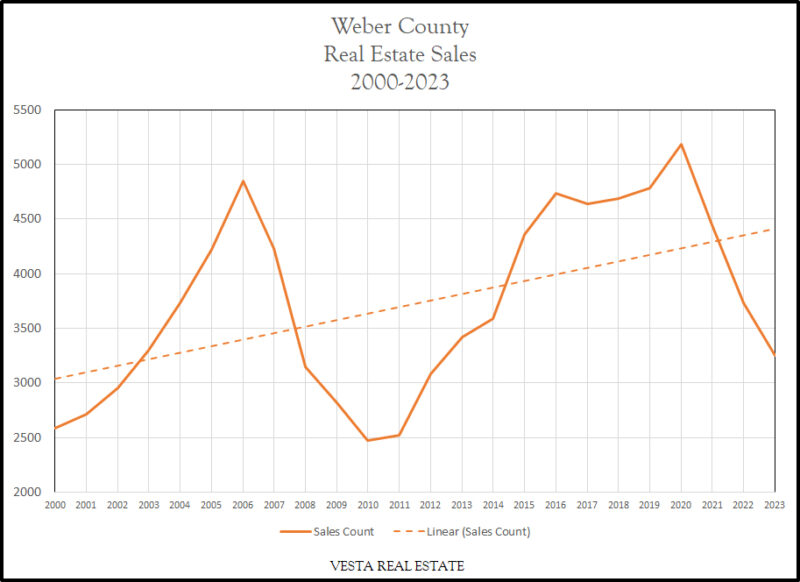
Here we can see just how far recent sales have deviated from the 23-year trendline. What this chart indicates is that, yet indeed, there is pent up demand for housing and that the Great Affordability Crises we are currently in will likely resolve itself with a return to the trendline. In fact, if history is any guide, sales will overshoot it again. Our annual transaction volume deficit is about 1,100 transactions per year currently. That is a lot of homeowners that are going to need professional help selling when the market decides to turn.
In the meantime, if you need an expert to help you navigate this dynamic real estate market, give me a call at 801-390-1480