
Northern Utah Real Estate Market Update – October 2023 – Market Spooktacular
Published On: October 11, 2023 Posted by: Jeremy Peterson
Due to some technical difficulties with video, today’s market update comes to you in the form of an old fashioned written blog. So, let’s commence with something we should probably be doing a lot more of anyway…reading.
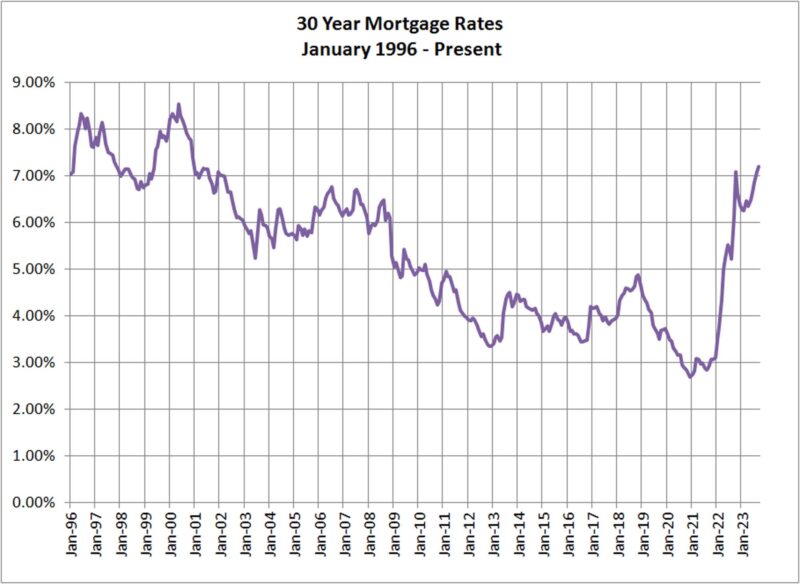
We will start with the villain of today’s story which happens to be 30-Year Mortgage interest rates. They will be lurking in the background laughing as I present the rest of today’s charts. As you can see, rates are high and headed higher. That market is reacting accordingly.
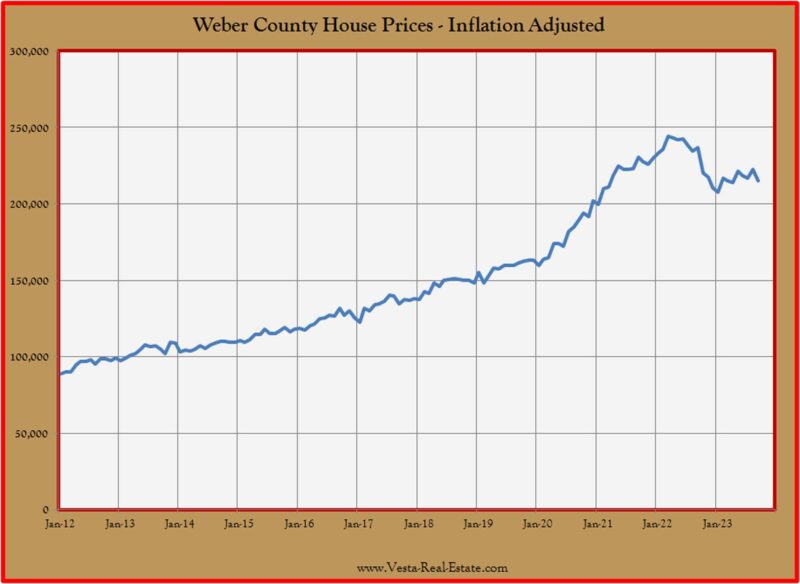
Inflation adjusted house prices in Weber County consolidated in 2022 as rates topped out around 7%. The pull back in rates after that peak restarted a trend upward in prices. But the most recent rates are testing this trend. We will know soon if the pattern is going to repeat.
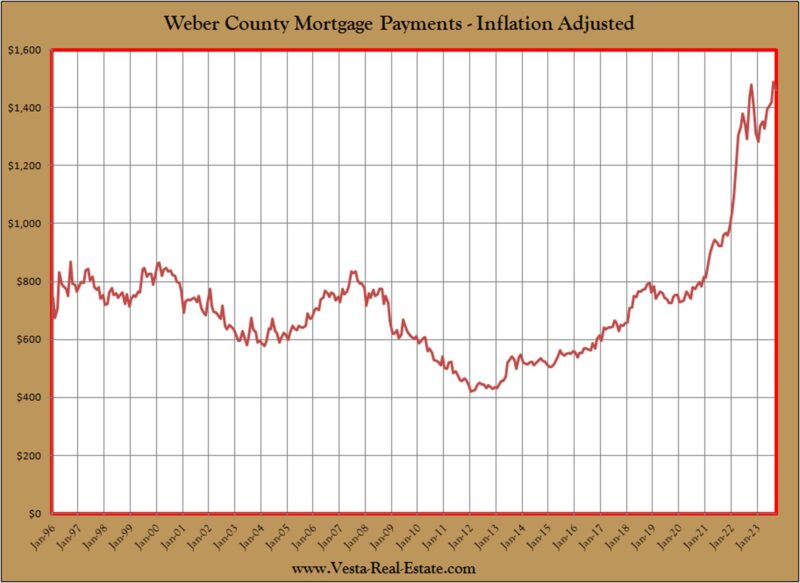
The recent surge in rates has catapulted inflation adjusted mortgage payments again to record levels. This signifies maximum pain for buyers right now. The silver lining here is that any buyer making a purchase in the current market has a good chance of refinancing to a lower payment in the future when rates drop. If they can afford it now, they will be even that much better off when rates moderate.
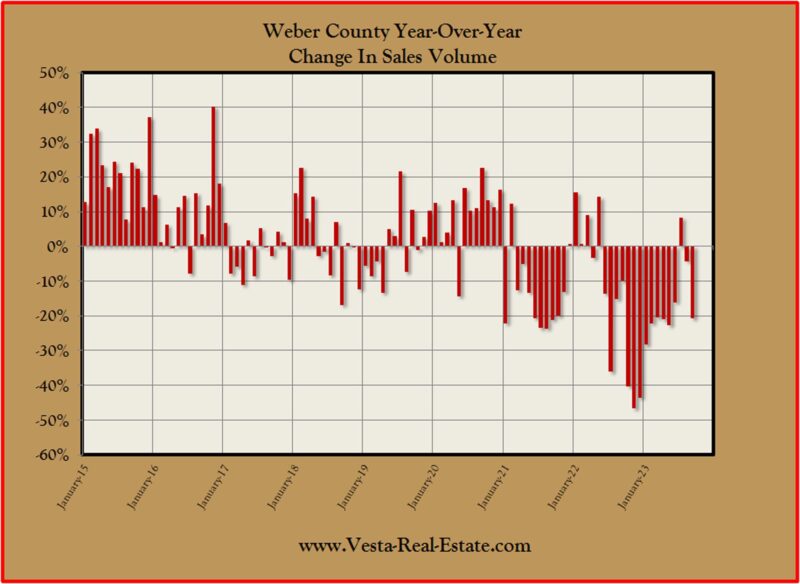
Not surprisingly, sales volume is taking a beating again with fewer buyers in the market that are able to afford current prices at current interest rates. September saw sales volume drop another 20% from last year’s already depressed sales figure.
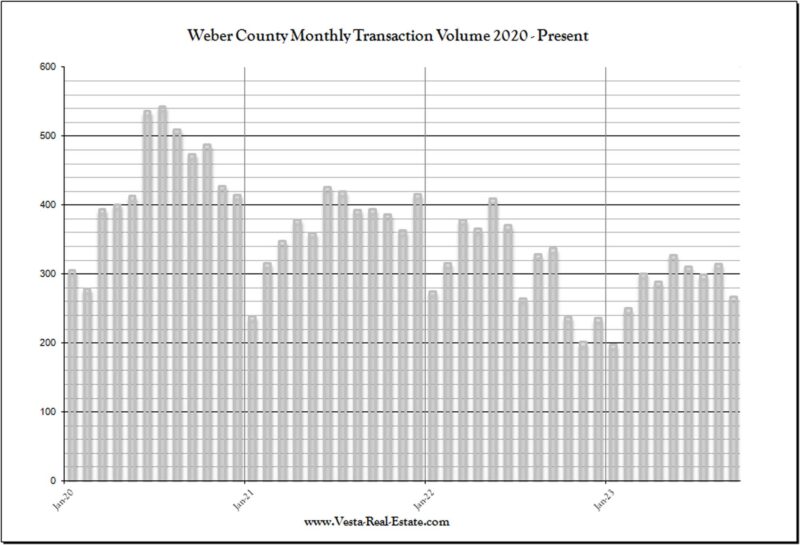
This trend is manifest in the sales volume chart covering 2020 through today. The peak sales volume for this market cycle occurred in July 2020 and has trended downward since.
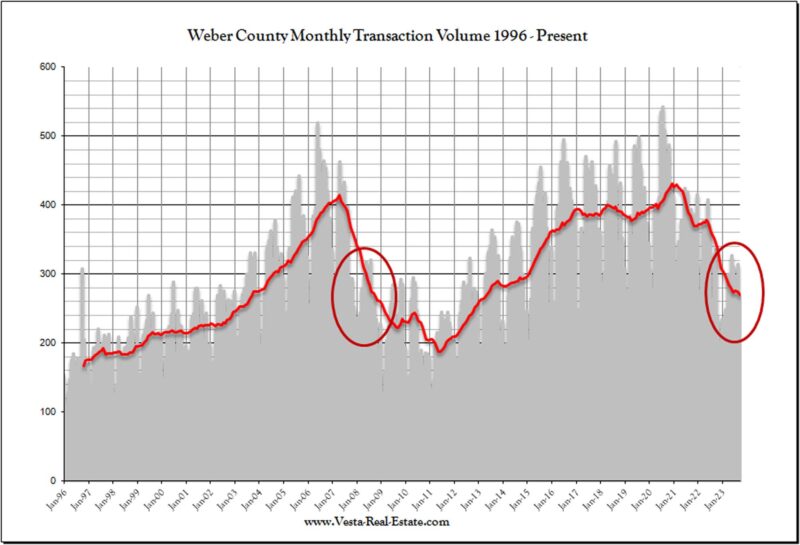
To keep current sales volume in perspective, we haven’t had a year like this since 2008 as the Great Financial Crisis started to kick off. History doesn’t repeat but it does rhyme. Are we headed for even bigger declines in sales volume? The catalysts from 2008 are not in play this time, but other forces may drive a continued slump. It will be fascinating to watch this wheel turn over the next year.
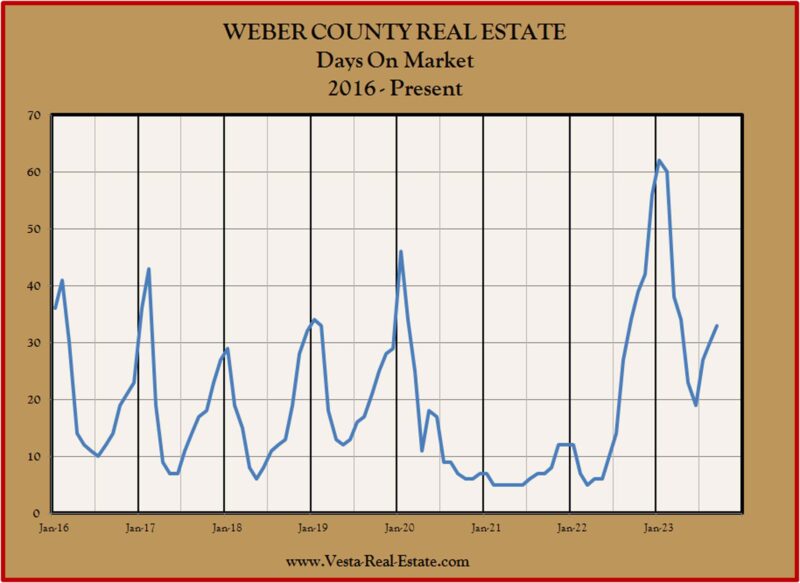
Happily, we don’t yet appear to be experiencing the violent swing in days-on-market we experienced last year. At 33 days currently, this is moderately higher than previous pre-Covid years at this time in the cycle but still much lower than last year. The bottom line is that homes which are selling are still selling in a respectable time frame.
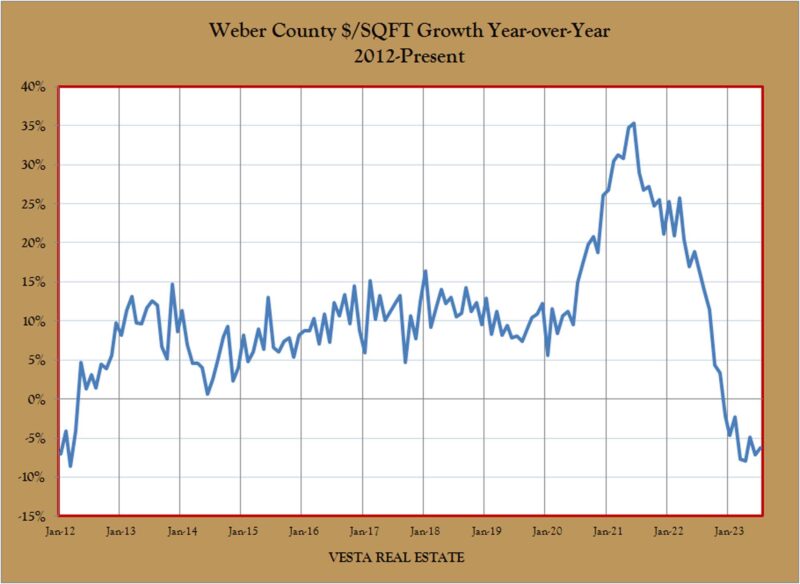
And finally we have our price growth chart which shows us the direction and speed of changes in house prices. This is a year-over-year comparison chart. As you can see, house price continue to depreciate from where they were a year ago.
While these charts may cause concern, everything isn’t doom and gloom. There are great opportunities in every market for those who are prepared and have a plan. If you are looking to buy or sell your property and need a professional to talk to, give me a call at 801-390-1480.