Ogden Real Estate Market Update – Spring 2018

Published On: March 27, 2018 Posted by: Jeremy Peterson
The Ogden real estate market continues to sizzle. It has been so hot for so long now that memories of a buyer’s market have faded into the realm of myth and legend. But, seasoned agents like me can tell you, this won’t last forever. So, when exactly will a change come? Its anyone’s guess. In the meantime, we can look at these charts and get a sense for where we are in the market cycle.

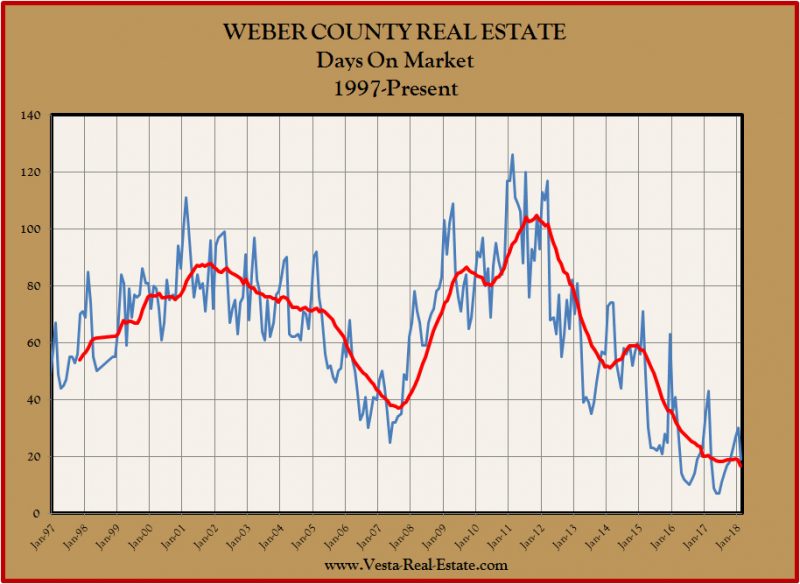
This chart shows the average time that a home sits on the market before an offer is accepted by a seller. We call this Days-On-Market (or DOM). You can see here that since 2012 the time it takes to sell a home on the market has declined steadily. There was a brief head fake in 2014. But since then the DOM has seen tremendous pressure downward. Most of this is due to the lack of new construction available to house all the in-migration that has been happening statewide.
During the peak of the real estate bubble in 2007, houses were selling on average in 39 days. Today they are averaging just 19 days! How long will this last? Until demand for housing stalls or builders flood the market with new homes. Yet, labor is in short supply and materials are expensive which means home builders are taking about 7-10 months to build a home when in previous decades they could construct homes in a matter of a few months. Given the constraints, my bet is that demand will ebb before builders can catch up to buyers’ current appetite for housing.

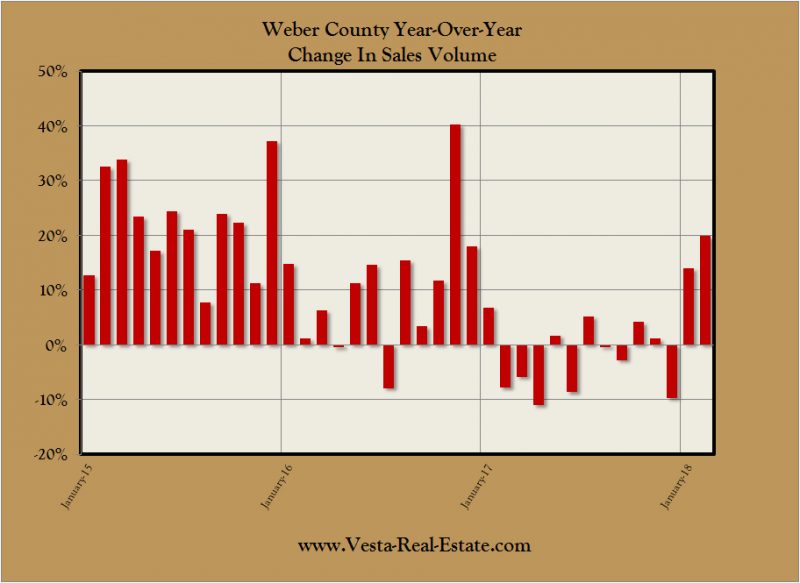
The volume of homes sold also tells us which direction the market is moving. In this chart you can see that year-over-year sales increased significantly in 2015 and began to moderate in 2016. In 2017, we actually saw total sales decline. This was in part due to the acceleration in house prices. Sellers realized that if they sold their homes, they wouldn’t be able to afford the next one. Buyers have also found themselves squeezed out of desirable housing as prices are bid beyond their reach. However, 2018 appears to show sales growth better than at any time during the past year. We will have a better picture on why this is happening, and if it will continue, later this year.

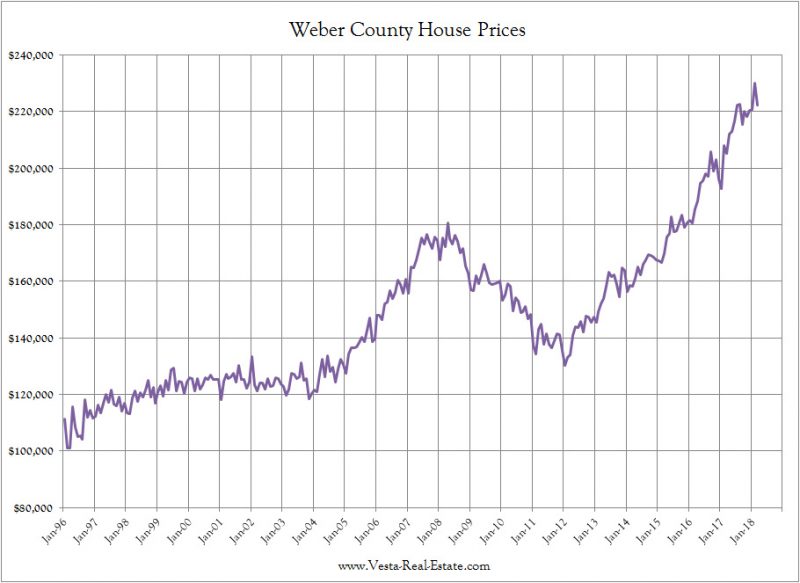
Everyone wants to know what house prices are doing. When they go up, that is a good thing. When they come down, that is bad. Increased values usually leads to a rush into real estate. This cycle is not an exception. This chart is derived from the price per square foot for homes that have sold in Weber County. As you can see, prices have been launching to the moon. From 2012, the seasonal pattern has prices surging in the spring and then moderating through the fall and winter while the market takes a breath. Then the pattern repeats. Will we see this pattern repeat this spring? We are about to find out.

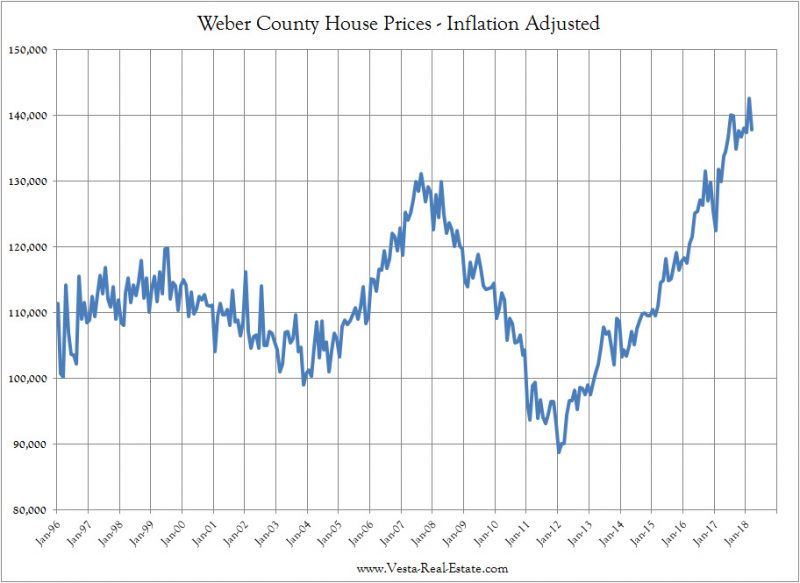
Finally, this is the chart that I follow religiously. This inflation adjusted chart helps us gauge relative value. This chart shows us that the swing in home prices from the depths of the housing recession have been dramatic. We have now exceeded our 2007 bubble peak in a real-terms inflation-adjusted basis. This could mean we have entered a new paradigm where prices are going to be higher for a while. Or it could be a bubble. It may be that prices plateau while we wait for inflation to catch up. This would be my best case scenario. But, if so, when will they plateau?
While exact dates of a housing market swinging to a buyer’s market is unknown there are mile markers along the path to tell us where we are at. House prices are based on buyer’s income and what they can afford (typically on a mortgaged basis). So, interest rates and income play big factors in determining house prices. Low interest rates mean higher house prices, all other things being equal. Higher income means higher house prices as well. The reverse is also true. Lower incomes and higher interest rates mean lower house prices.

Incomes are generated by jobs and jobs are generated by corporations for the most part. Therefore, the financial health of corporations is a precursor to jobs. When corporate books are in bad shape, they cut jobs and trim labor to shore up its income statement. Typically we know if a corporation is ill if its sales are in decline or its debt load is too great. Presently, U.S. corporations have record levels of debt. They exposed to interest rate risk just as home buyer’s are when they purchase a home.
My prediction is that this record level of debt will translate into layoffs whenever interest rates reach a tipping point. This in turn would take 6 to 9 months before affecting the housing market as freshly laid off workers put their homes up for sale. So, if there is a bear stock market, look for a shift in the housing market within a year of that happening.
Regardless of what the market does, life goes on and we all need a place to live. So, if you need help buying or selling your home, CONTACT ME, and let’s put a plan together for you in light of whatever market conditions prevail.


