
REAL ESTATE INVESTMENT: A Look At Current Market Trends
Published On: September 23, 2015 Posted by: Jeremy Peterson
Real Estate is a powerful tool for creating wealth. It is a relatively stable investment that can be used to reduce tax burdens, improve income, increase net worth, and preserve wealth through the generations. So, when it comes to getting in the market and finding the right investments, it is important to know the underlying market trends that are making things happen.
Since residential income property is one of the best sources of rent revenues, lets take a look at how the market has behaved over the past several years. Our first chart shows us sales volume:
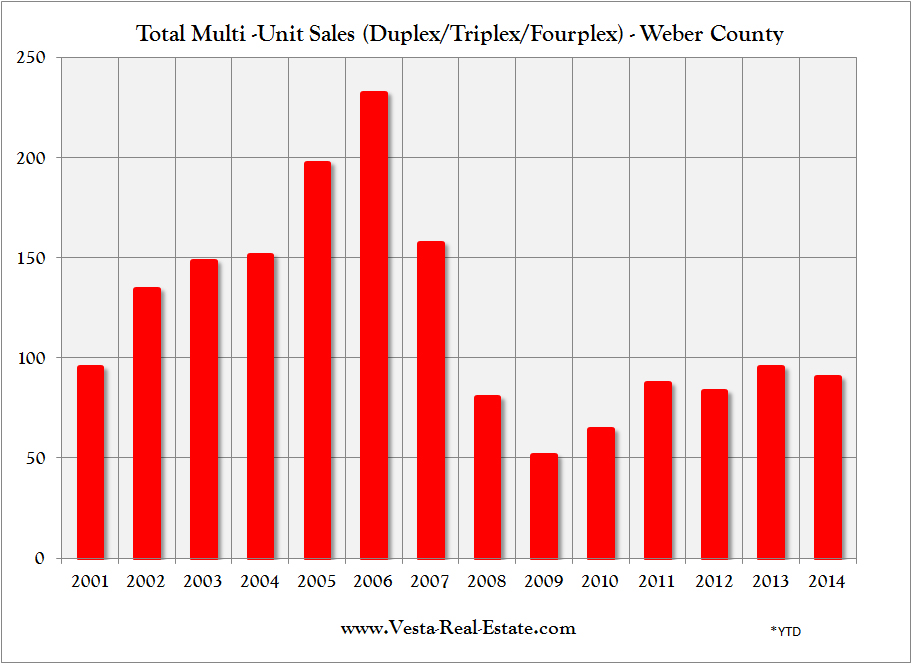
Here we see the frothy bubble years of 2006 and 2007 followed by the mortgage meltdown in 2008 and the collapse of bank lending in 2009. During the bubble years, lenders loosened guidelines so that properties could be purchased with little downpayment and shoddy borrowing credentials. During the meltdown, many mortgage companies went out of business and left buyers and sellers willing to transact but without the market mechanisms in place to consummate their transactions. The precipitous decline in sales volume reflects this change.
Between 2009 and 2012, most of the transactions occurring were done with cash at steeply discounted prices. But, by 2012, lenders were once again issuing loans but this time with more stringent guidelines. Currently lenders require a 25% downpayment to purchase multi-unit property. By contract, the requirement for single family homes is 20%. These numbers are much larger than we have been used to which has kept sales volume constrained below 100 transactions per year.
Understanding the market mix based on financing is also important. For the sales volume that occurred in the market, here is a chart showing how those transactions were completed. Some were done with conventional bank loans, others with seller financing, some with cash, and others were done with owner-occupied FHA/VA financing – a sort of pseudo-investment situation. This chart tells us a lot:
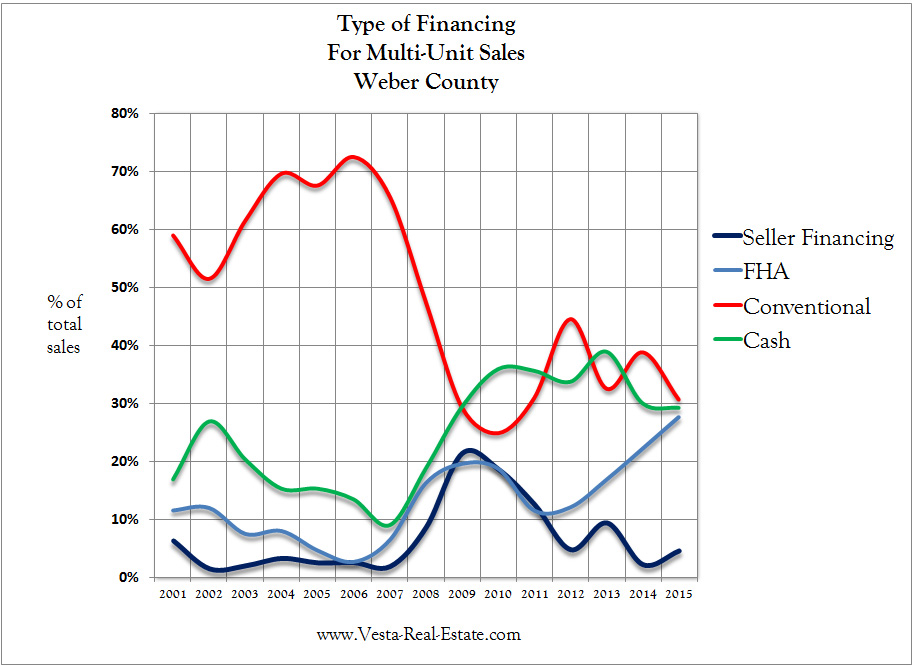
You can see that as conventional financing plummeted in the crash, seller financing and cash became an increasing part of the market mix. What is interesting is that FHA, Conventional, and Cash all play equal parts now in today’s market. The sustained level of cash purchases is also a curious phenomena. Clearly, investors are still cash flush and pushing those funds into real estate.
Yet, one of the more interesting things to watch is price movements in the market. The income property market is complicated with various kinds of financing available. The forms of financing often follow different price trajectories and this helps inform us where to find opportunity in the market. Lets take a look at how financing affects price points in the market.

People are less concerned about price when they are using other people’s money. This shows up in our ‘Conventional’ financing chart. As foreclosed properties flooded the market and increased downpayment requirements hindered demand, price points declined significantly from 2010 through 2013. If we cross reference our sales volume chart, we can see that volumes increased even as prices declined for some time. What is most interesting is that prices for 2015 are surging upward at an incredible rate. Our trendline has surpassed levels last seen during the frothy bubble years. Of course the difference this time is that buyers are putting 25% down. So, the price points today are a truer reflection of value than those in yesteryear’s credit-soaked era of speculative buying.
Now lets take a look at how cash buyers are faring:

Here we can see the plunge into the abyss that prices took as foreclosures clogged the market and cash buyers reaped a windfall. Average prices dropped from $65/sqft to $30/sqft for buyers paying with cash. That is an amazing 55% drop in price! And, as you can see from the chart, prices didn’t stay there very long. They plateaued for about 6 months before surging upward. Today, it appears prices are plateauing again around $57/sqft. They haven’t returned to record highs but the market is not speculative right now. Investors are placing their money with an eye toward a positive cashflow. Fortunately, today’s low vacancy rates and a fully employed workforce make for stable and reliable rents.
Now, lets take a look at our quirky friends who want to owner-occupy their investment property:

As we would expect, owner occupents are less picky when it comes to price points. Here we see that the range of values for those purchasing property that they will occupy is very narrow. Simply put, people who want to live in a home, will pay more to do so.
Our next stop is the magical realm of seller financing:
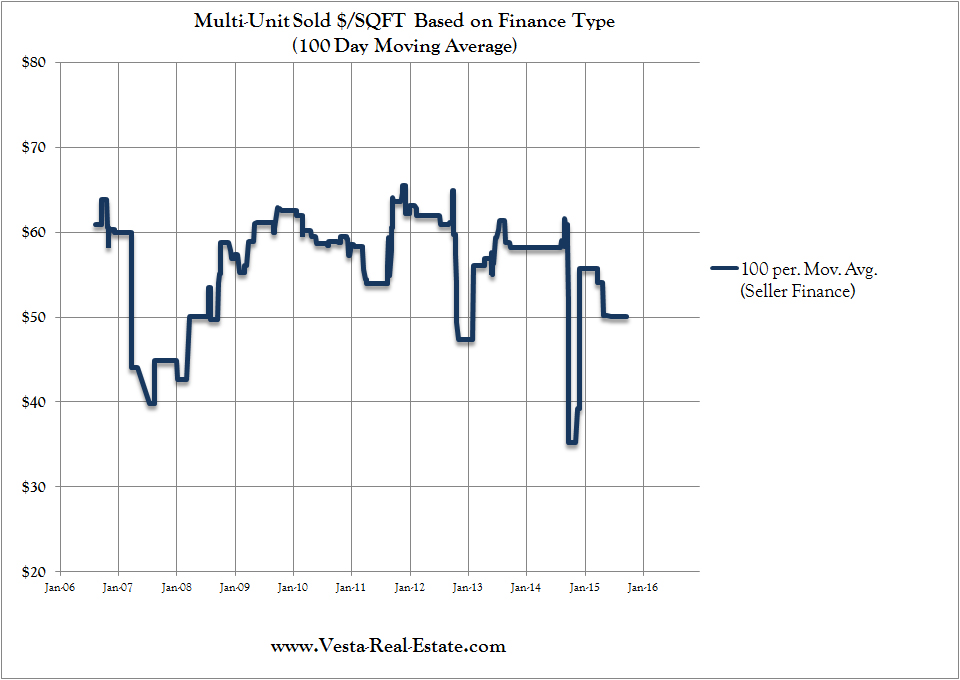
Due to the low transaction volume, this chart is pretty noisy and choppy. You can see during 2008-2011 that it becomes less chaotic due to increased sales volume. But, this chart does tell us a few things. For starters, during the bubble, the price/sqft was very low. Because traditional lending was so easy back then, homes that sold with seller financing typically were in such bad condition they could not be financed normally. Thus, the low valuation. But, as the mortgage market went apoplectic, properties that were in much better condition became available. Buyers and sellers were willing to transact with seller financing and the price points reflected both the premium paid for the courtesy of seller financing as well as the availability of homes in superior condition.
As the traditional lenders loosed their guidelines, seller financing faded as a means of transacting. I have closed several seller financing transactions this year, but it is not as abundant as it once was.
For a side by side comparison of these trends, here is an eye-popping chart:

So what do all these charts mean? There are a couple takeaways that investors should note. First, these trends reflect averages in the market. For every transaction that occurred above the average, there was a transaction that occurred below the average. Ideally, you want to be that guy – the one who purchased property below the market average. Regardless of the market, there is always good opportunity relative to current market conditions. The key is being able to find it and move on it quickly.
The second lesson we learn from these charts is that adapting to market conditions is essential to finding the right deals and making good investments. Investors that embraced seller financing were able to accomplish a lot more than those that waited for banks to get their act together and start lending again. Where there is a will, there is a way.
If are seeking financial independence or have an eye on retiring on real estate income and are looking for the right deals, CONTACT ME, and lets put a strategy together that will improve your net worth and increase your cashflow.